

Statistics Fundamentals: Mean, Probability and More
Statistics Fundamentals help us understand data, compare numbers, find patterns, and make better decisions. Statistics is used in business, science, medicine, education, finance, technology, and everyday life. By learning basic ideas such as mean, median, probability, sampling, standard deviation, and correlation, beginners can understand how data works and how researchers turn numbers into useful information.
What Are Statistics Fundamentals?
Statistics Fundamentals are the basic methods used to collect, organize, study, and explain data. Statistics helps answer questions such as: What is the average result? How different are the values? How likely is an event? Can a small sample tell us something about a larger group?
Statistics has two main areas. Descriptive statistics explains the data already collected by using averages, percentages, charts, and measures of spread. Inferential statistics uses sample data to make estimates or test ideas about a larger population. Both areas are important when working with real-world information.
Types of Data and How They Are Classified
Before analyzing information, it is important to understand the type of data. Qualitative data describes categories or qualities. Examples include eye color, product type, job role, or country. These values usually cannot be measured with normal mathematical operations.
Quantitative data uses numbers. It may be discrete, such as the number of children in a family, or continuous, such as height, weight, temperature, or time. Knowing the data type helps a researcher choose the right calculation, chart, and statistical method.
Mean, Median, and Mode Explained
The mean is the most common type of average. To calculate it, add all values and divide the total by the number of values. For example, if five test scores are 60, 70, 75, 85, and 90, their total is 380. Dividing 380 by five gives a mean of 76.
The median is the middle number after values are placed in order, while the mode is the value that appears most often. Median is useful when very high or low values affect the mean. Mode can work with both numerical and category data, making it useful for identifying the most common result.
Range, Variance, and Standard Deviation
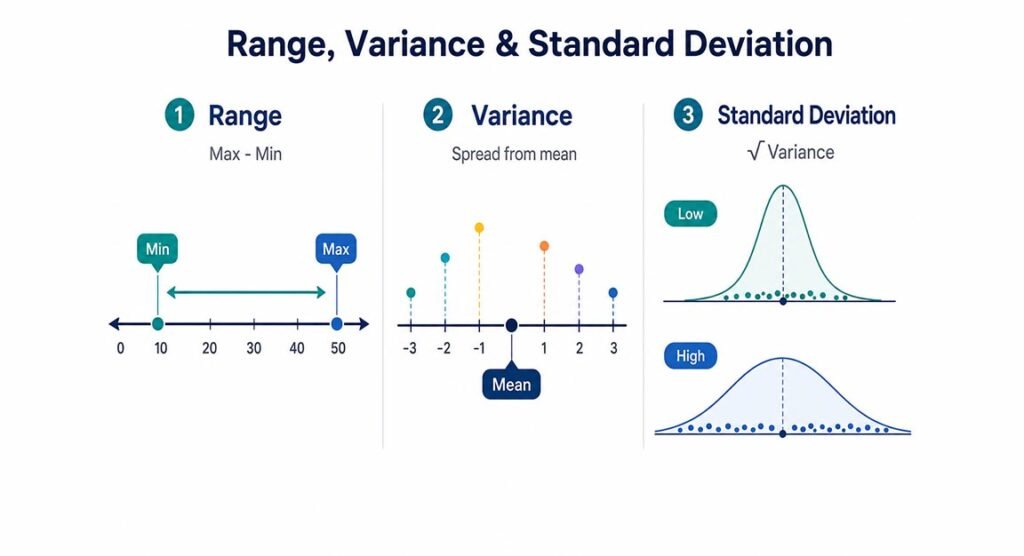
Measures of center do not tell the full story. We also need to know how widely the values are spread. The range is the difference between the highest and lowest values. If the lowest score is 20 and the highest is 90, the range is 70.
Variance measures how far values are spread from the mean. Standard deviation is the square root of variance and is easier to understand because it uses the original measurement unit. A low standard deviation means values stay close to the average, while a high one shows greater variation.
Probability Basics and How Probability Works
Probability is an important part of Statistics Fundamentals because it measures uncertainty. Probability values normally range from 0 to 1. A probability of 0 means an event cannot happen, while 1 means it is certain. A value of 0.50 represents a 50% chance under the conditions being studied.
For example, a fair six-sided die has six possible results. The chance of rolling a 4 is 1 out of 6, or about 16.7%. Probability also includes ideas such as independent events, conditional probability, sample spaces, and probability distributions. These concepts are widely used in risk analysis, insurance, science, and forecasting.
Probability Distributions and the Normal Distribution
A probability distribution shows the possible values of a random variable and how likely each result is. Common examples include the normal, binomial, uniform, Poisson, and Student’s t distributions. Different distributions are used for different types of data and research questions.
The normal distribution is one of the best-known models. It has a balanced, bell-shaped form, with many values near the mean and fewer values farther away. In a normal distribution, about 95% of observations fall within roughly two standard deviations of the mean. However, not every real dataset follows this shape.
Population, Samples, and Sampling Methods
Sampling is a key part of Statistics Fundamentals because researchers often cannot study every person or object in a population. A population is the complete group of interest, while a sample is a smaller group taken from that population.
For example, if a company has 50,000 customers, researchers may survey only 1,000 customers. Good sampling methods include simple random sampling, systematic sampling, stratified sampling, and cluster sampling. A poorly selected sample can create bias, while a well-designed sample can give more reliable information about the larger population.
Confidence Intervals and Hypothesis Testing
A confidence interval gives a range of reasonable values for an unknown population value. For example, researchers may estimate that average customer spending is $50, with a confidence interval from $47 to $53. This range shows that the estimate includes some uncertainty.
Hypothesis testing helps researchers examine a specific claim. The null hypothesis usually represents no effect or no difference, while the alternative hypothesis represents another possibility. Researchers often use a p-value to measure how unusual the observed results would be if the null hypothesis were true. Statistical significance should still be considered together with real-world importance.
Correlation, Regression, and Relationships in Data
Correlation describes the strength and direction of a relationship between two numerical variables. A positive correlation means the variables tend to move in the same direction. A negative correlation means one often rises while the other falls.
However, correlation does not prove causation. Two things may move together because of another factor. Linear regression goes further by creating a mathematical line that can describe or predict a relationship. Regression is widely used in economics, business, science, and data analysis, but predictions should be made carefully.
Common Statistics Mistakes and How to Read Data Correctly
One common mistake is looking only at the average. Two groups can have the same mean but very different levels of spread. Another mistake is ignoring sample size, sampling method, outliers, or missing data. These factors can strongly affect the final result.
People should also avoid treating every statistically significant result as important in real life. Large samples can make very small differences appear significant. Good data analysis considers the numbers, the research method, the size of the effect, and the wider context before making a conclusion.
Why These Statistical Basics Matter
Understanding Statistics Fundamentals makes it easier to read research, compare business reports, understand surveys, and judge claims based on numbers. Mean, median, and mode explain the center of data, while range and standard deviation describe spread. Probability explains uncertainty, and sampling connects small groups with larger populations.
Confidence intervals and hypothesis tests help researchers make careful conclusions, while correlation and regression show relationships between variables. Learning these basics gives students, professionals, and everyday readers a strong foundation for more advanced areas such as data science, machine learning, economics, and scientific research.
FAQs
What is the easiest way to understand statistics?
Start with basic ideas such as mean, median, mode, range, and probability. Once these concepts are clear, sampling, distributions, and statistical testing become easier to understand.
What is the difference between mean and median?
The mean is calculated by adding all values and dividing by the number of values. The median is the middle value after the data is placed in order.
Why is probability important in statistics?
Probability helps measure uncertainty and likelihood. It allows researchers to study possible outcomes, estimate risks, and make conclusions when the future is not certain.
What does standard deviation tell us?
Standard deviation shows how much values usually vary around the mean. A small standard deviation means values are close together, while a large one means they are more spread out.
Does correlation mean one thing causes another?
No. Correlation only shows a relationship between variables. It does not prove that one variable caused the change in the other.